10x Data Analyst and AI Certification Program

Discover how data can empower your decisions and leadership.
Join our program and gain practical skills, learn industry-standard tools, and
stand out as a qualified data analyst!
This course is rated as excellent
by 90% of the learners
Are You…


Feeling left behind as
your industry becomes
more data-driven?

Thinking to transition
into the tech industry from
a non-tech background?

Looking to gain practical
tech experience but unsure where to find opportunities?

Struggling to learn new
tech skills without
quitting your current job?

Interested in learning Python
or R for data analysis but find it intimidating?
If the answer is “Yes” to any of the above, this program is for you.

| L1: Getting Started with Google Sheets |
| L2: Mastering the Basics of Google Sheets |
| L3: Mastering Google Sheets Functions |
| L4: Pivot Table Foundations: Mastering KPIs and Data Analysis |
| L5 : Charts and Dashboarding : Advanced Techniques for Data Mastery |
| L6: Introduction to Google Apps Script |
| L7: Building Blocks of Google Apps Script |
| L8:Custom Functions Deep Dive in Google Sheets |
| L9:From Mockups to AI: Preparing for OpenAI GPT Integration |
| L10:Bringing GPT to Life: Implementing Real AI Functions in Google Sheets |
| L11:Implementing Advanced GPT Functions |
L1: Introduction to Data Warehousing |
L2: Data Warehouse Architectures and Design Principles |
L3: SQL Commands Fundamentals |
L4: Advanced SQL for Data Retrieval |
L5: Data Manipulation and Transformation with SQL |
L6: Performance Tuning Fundamentals |
L7: Introduction to ETL Processes |
L8: Building ETL Pipelines with SQL |
L9: Introduction to BigQuery for Data Analysis |
L10: Advanced BigQuery Techniques |
L11: Data Governance in Data Warehousing |
L12: Security Best Practices for Data Warehouses |
L1: Introduction to Statistical Modeling |
L2: Probability Theory and Distributions |
L3: Overview of Machine Learning Concepts |
L4: Correlation Analysis and Its Applications |
L5: Simple Linear Regression |
L6: Multiple Linear Regression and Polynomial Regression |
L7: Classification Algorithms (Logistic Regression, Decision Trees) |
L8: Clustering Techniques (K-means, Hierarchical Clustering) |
L9: Introduction to Time Series Analysis and Forecasting |
L10: Ensemble Methods (Decision Tree,Random Forests, Gradient Boosting) |
L11: Hyperparameter Tuning and Cross-Validation |
L12: Dimensionality Reduction Techniques (PCA, t-SNE) |
| L1: Introduction to Tableau |
L2: Chart Creation Fundamentals |
L3: Data Preparation Techniques for Tableau |
L4: Enterprise Dashboarding on Tableau |
L5: Data Modelling and Cleaning in Tableau |
L6: Visualizing Live Datasets in Tableau |
L7: Tableau Functions & Calculations |
L8: Understanding and Implementing Level of Detail (LOD) Expressions |
L9: Data Blending and Publishing in Tableau |
| L1: Introduction to Python for Data Analytics |
| L2: Python Data Structures and Control Flow |
| L3: Functions and Modules in Python |
| L4: Introduction to NumPy for Numerical Computing |
| L5: Data Cleaning and Preprocessing |
| L6: Advanced Data Manipulation with Pandas |
| L7: Data Normalization and Standardization Techniques |
| L8: Descriptive Statistics in Python |
| L9: Exploratory Data Analysis (EDA) Fundamentals |
| L10: Data Transformation Techniques |
| L11: Feature Engineering Strategies |
| L12: Advanced Pandas Operation |
| L13: Data Visualization with Matplotlib |
| L14: Advanced Plotting with Seaborn |
L15: Interactive Visualizations using Plotly and Cufflinks |
L16: Introduction to OpenAI’s GPT Models |
L17: Integrating ChatGPT with Python for Data Analysis |
| L18: Automated Reporting and Analysis using Python and AI |

This project helps you master data visualization skills for healthcare analytics,creating KPIs,
use calculated fields and parameters, and applying charts like pie charts and line graphs to
explore patient flow, costs, and service efficiency. It also builds business acumen by enabling
insights into resource allocation,improving decision-making.

This Project helps you in gaining advanced skills in creating dynamic dashboards that reveal key insights into sales trends and profitability across regions, helps in using geographic visualization to map sales density, implement smart filtering for targeted analysis, and craft KPIs for product performance. This project enhances your business acumen by offering a deep understanding of custA Tableau Dashboard on Coffee Chain Success helping to inform strategic decisions in retail management.

This project enhances skills in data manipulation through joins and pivoting, enabling the creation of dynamic dashboards that reveal public transport trends and efficiency. It fosters business insights into operational improvements and resource allocation.
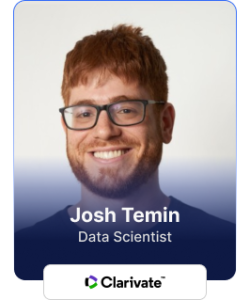
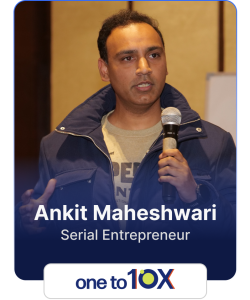
Program Mentors
Learn from the best


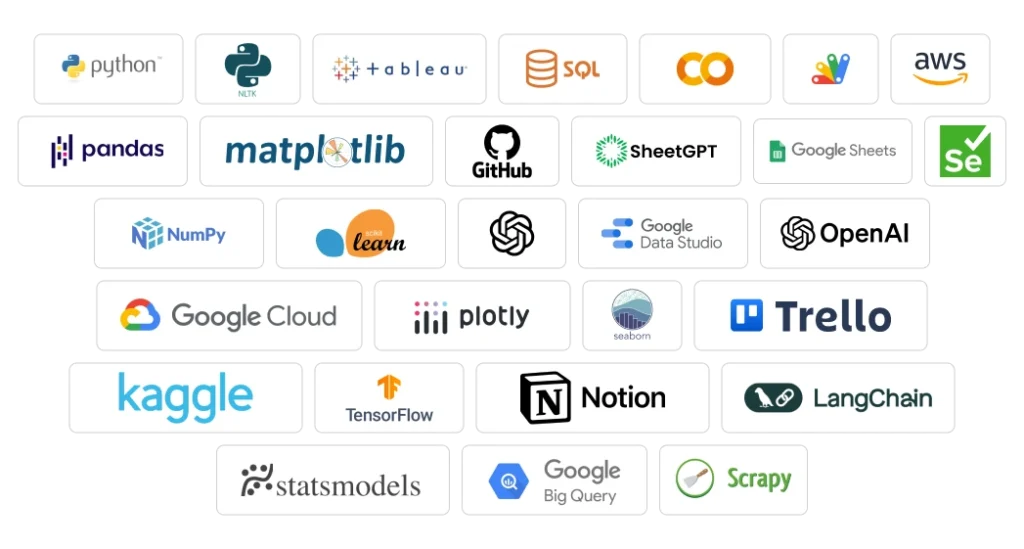
…and master these tools
🚀 Just wrapped up an incredible 2-day bootcamp with 1to10x, and I’m excited to share some key takeaways, complete with visuals! During this hands-on experience, I dove into various tools and techniques that are essential for today’s data-driven world:
📊 Tableau: Learned how to create basic dashboards and charts by tackling a real business case for a cosmetics company.
Visualizing data to uncover insights was a game-changer! 🔍 Orange: Built data models for customer segmentation, focusing on boosting business profits and revenues. The possibilities of machine learning in driving business strategies are endless.🕵️️ Octoparse: This was my first time using Octoparse, and I was able to successfully web scrape job listings for Data Analysts in Doncaster from Indeed. The experience was a real eye-opener, showing me the power of data collection at scale. This achievement has significantly boosted my confidence in working with new tools! 🤖 GPT for Google Sheets: Explored how AI can assist in cleaning, manipulating, and preparing data seamlessly. This integration is going to streamline so many of my future projects.
This bootcamp was an excellent opportunity to sharpen my skills and apply them to real-world scenarios. The confidence I’ve gained has motivated me to take on even more challenging projects in the future, including DataCamp projects. Big thanks to 1to10x for such a well-structured and insightful experience! 🙌
Looking forward to applying these new skills in my current and future projects.

Remote Administrator
Just wrapped up an incredible 2-day 10x Data Analyst Bootcamp, and it was an absolute game-changer!
The sessions were insightful, engaging, and truly morale-boosting. I had a blast learning about web scraping, spreadsheet Al automation, ML and other advanced data techniques.
The fast-paced, hands-on experience was both challenging and rewarding, and it’s safe to say I’m walking away with a deeper understanding of data analytics and some exciting new skills.
A huge thank you to the instructors and my fellow participants for making it an unforgettable learning experience!
#DataAnalytics #WebScraping #Al #Automation #Bootcamp #10xLearning
#ContinuousImprovement #GrowthMindset

Data Analyst
Intensive 1to10x Data Analytics Bootcamp, and I’m thoroughly impressed! 💼 The course expertly balanced theory with practical application, which is crucial in the finance sector. Learning to use Octoparse for web scraping financial data was an unexpected highlight – it’s opened up new possibilities for market research.
The sections on data modeling for customer segmentation will undoubtedly enhance our client targeting strategies. Kudos to the 1to10x team for a well-structured and insightful program!
#FinTech #DataDrivenFinance #1to10x
Financial Advisor
Just wrapped up the mind-blowing 1to10x Data Analytics Bootcamp! 🚀 This 2-day intensive course was exactly what I needed to kickstart my journey into data science. The session on using GPT for Google Sheets was a game-changer – I can already see how it’ll streamline our reporting processes.
Big shout out to Ankit and his team!

Product Manager
From SQL newbie to data querying pro in 48 hours – thanks to 10x Data Analyst Bootcamp! I never thought I’d be so excited about data analysis! The hands-on approach to tackling real business cases made the learning experience incredibly engaging.
Huge shoutout to the instructors for their patience and expertise!
Marketing Analyst
I recently attended the 10x bootcamp to improve my data analysis skills for our solar energy projects. The sessions on analyzing weather patterns for energy production were directly applicable to my work. I found the programming parts challenging, but the hands-on exercises were very helpful!
There’s still much to learn, but I feel better equipped to handle the data now! Thank you 1to10x
Renewable Energy Technician
Attended the 10x Data Analyst course. Pretty intense 2 days! As a small cafe owner, I was skeptical about how “big data” could help me, but it was eye-opening.
We did this exercise with cafe sales data – bit overwhelming at first. Learned some Excel tricks I didn’t know existed. Tableau was confusing but kinda cool once I got the hang of it.
The interesting part was looking at sales patterns. Turns out the time of day affects what people order way more than I realized. Also found out some of my regulars have super predictable habits – might try some personalized promos.
Lot to take in and I’m not sure I’ll use everything, but definitely got some ideas to try out. Overall, worth the time though my brain hurts now! Might even consider hiring a part-time data person down the road.
Independent Cafe Owner
Insightful and Practical Boot Camp for Aspiring Data Analysts
Thad a fantastic experience attending their 2-day boot camp. It provided valuable insight into data analysis, with hands-on experience working on four real-world projects that covered the key skills required in the field today.
The training was practical, engaging, and highly relevant for anyone looking to strengthen their data analysis knowledge. Ankit and his team were excellent, offering great support and guidance throughout the sessions. Overall, an insightful and highly recommended course!
Aspiring Data Analyst
I attended their 2-day boot camp. It was a great experience. We worked on 4 real-life projects covering all the modern-day requirements for Data Analysts. A must-attend training. Ankit and his team are awesome.
Thanks for such a useful training.
Aspiring Data Analyst
I’m thrilled to announce that I have successfully completed the 10x Data Analyst Bootcamp!
Over the past few weeks, l’ve had the opportunity to enhance my skills in key areas like:
Data Analysis with [specific tools: Excel, SQL, Python, etc.]
A Data Visualization using (Power BI, Tableau, etc.]
– Solving real-world data challenges
This bootcamp not only deepened my technical knowledge but also empowered me to solve complex problems and make data-driven decisions.
A big thank you to the incredible instructors and mentors who provided continuous support and guidance throughout the journey!
Now, I’m looking forward to applying these skills in real-world projects and contributing to data-driven strategies in the future. Let’s connect if you’re interested in discussing data analytics!
Student at University of Westminster


Here’s how this Certificate will set you apart:
⚪Open doors to new job opportunities and
faster promotions in the tech industry
⚪Gain access to internship programs with
leading industry partners
⚪Connect with a network of certified
professionals and potential employers
⚪Stay ahead of the curve with cutting-edge
AI and data analytics knowledge
Program Overview
Earn an Industry Recognized
Certification
Work on 25 Real-World
Case Studies & Projects
Get access to 25+ resources
and tools
Personalized Mentorship
24/7 Student Support
Earn an Industry Recognized
Certification
Scholarship Calculator
Assess your expected Financial Aid using our scholarship calculator
Dreaming of advancing your career but worried about costs?
We get it. That’s why we created our Scholarship Calculator.
This free tool isn’t just about numbers – it’s your gateway to new
opportunities- whether you’re upskilling, changing careers, or
pursuing a passion – we’re making growth accessible.
Ready to turn your professional goals into reality?
Want to get started? or just say ‘hi!👋’
Frequently Asked Questions (FAQs)
This program welcomes individuals looking to pivot into exciting data-focused careers or those seeking to deepen their understanding of AI and Data Science, even if they’re transitioning from non-tech backgrounds.
Live sessions are typically held weekly on weekends, making it easier for working professionals to participate.
The program includes comprehensive coursework, live sessions, personalized mentorship, real-world projects, career support, and access to our vibrant alumni network.
You’ll gain practical skills in data analysis techniques, SQL, Python, basic machine learning, data visualization, and introductory AI concepts—all essential for today’s data-driven landscape.
Graduates often find themselves well-equipped for various roles, including Data Analyst, Business Intelligence Analyst, and Junior Data Scientist.
Graduates often find themselves well-equipped for various roles, including Data Analyst, Business Intelligence Analyst, and Junior Data Scientist.
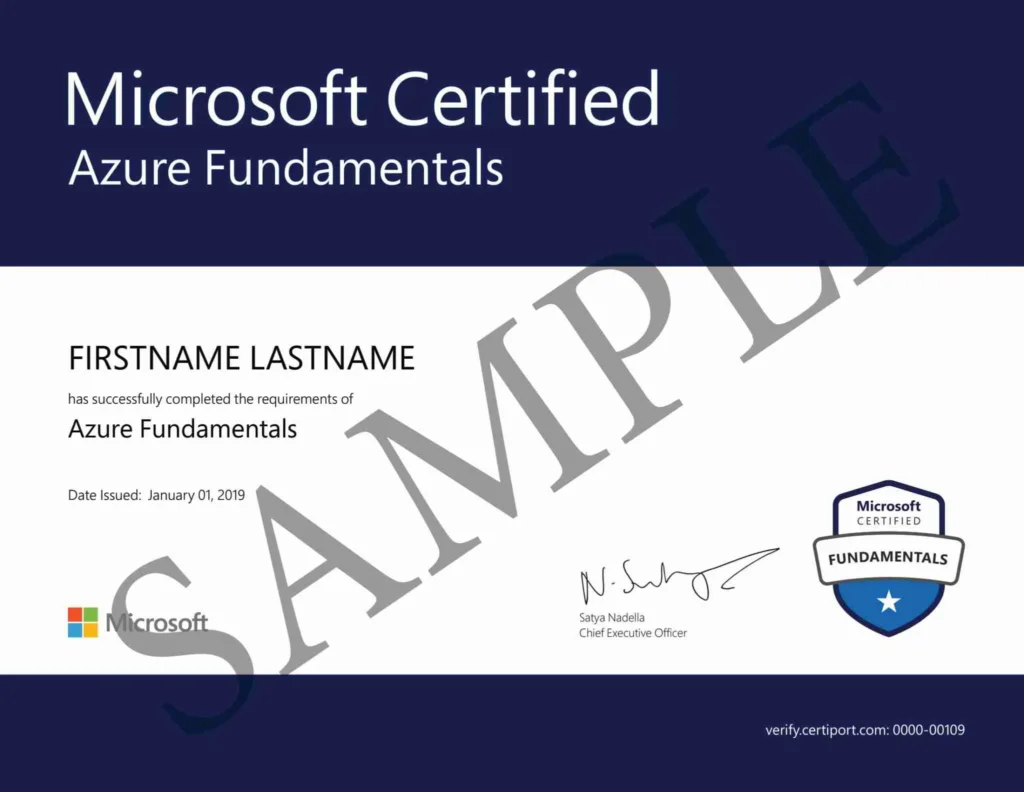
You’ll receive your Microsoft and 1to10x Certificate upon successfully completing all coursework and projects, typically within 6 months from the start of the program.